Illustrative research workflow
Explore now
Choose midbrain cells for follow-up
Which SNc cells and source sections merit a closer look before follow-up work?
Scientific context
SNc, 21 MB Dopa, 215 SNc-VTA-RAmb Foxa1 Dopa, and measured Th yield 231 matching cells; the selected follow-up record comes from section C57BL6J-638850.29.
The cell-only cohort view shows the local distribution. The inspector separately shows the selected cell's taxonomy, source section, and measured Th value.
A careful workflow
- Set Display limit to 100,000 through the Explorer UI.
- Apply the recorded source filters and review displayed versus matching counts.
- Inspect provenance before export or downstream interpretation.
Live Explorer walkthrough
What the current app shows
These are browser captures of the public Allen MERFISH release in NeuroViz. Open this captured cohort in Explorer.
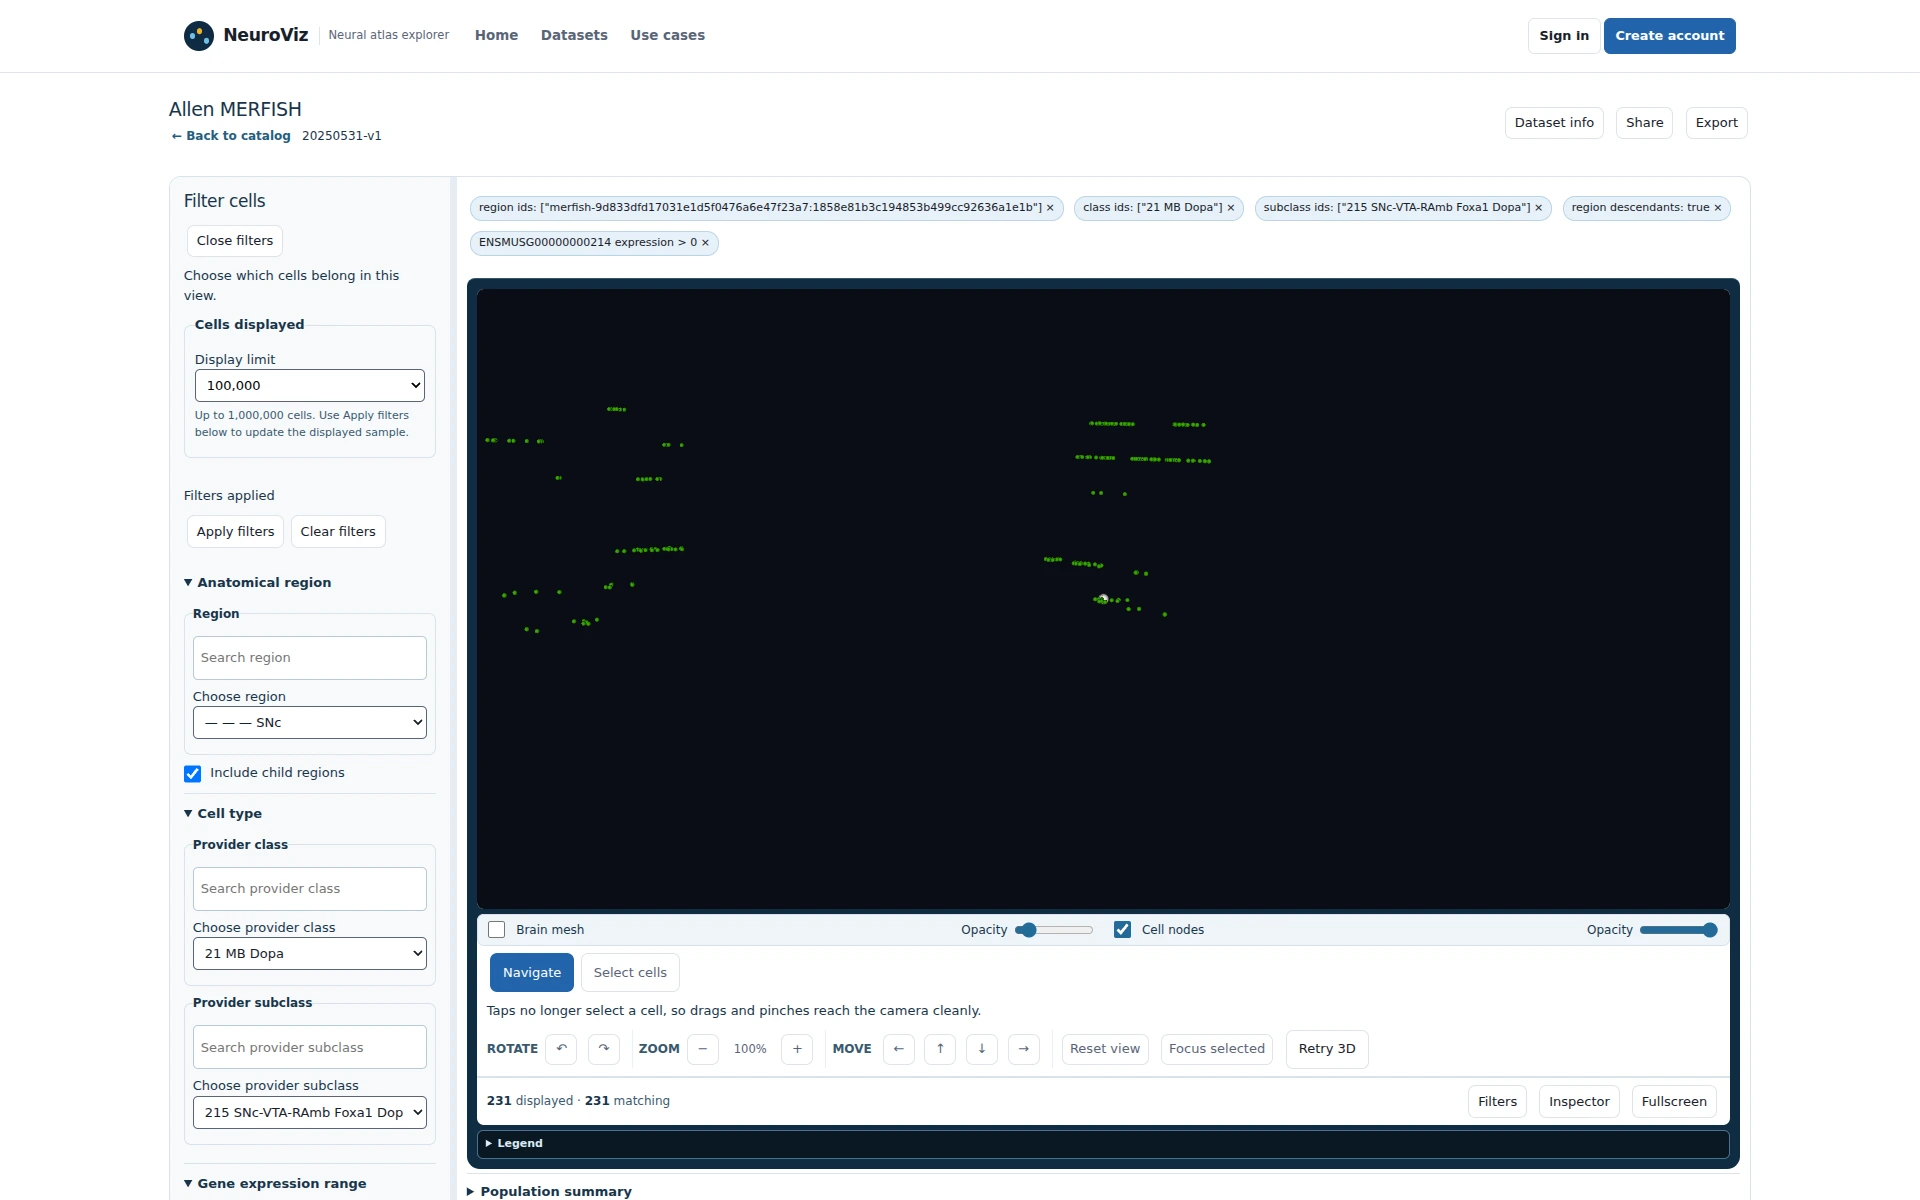
Figure 1Apply SNc, MB Dopa, Foxa1 Dopa, and measured Th at 100,000. 231 matching cells define the starting cohort.
A focused cell-only view shows the local SNc / Foxa1 Dopa / Th cohort without the brain mesh obscuring it. Click to enlarge.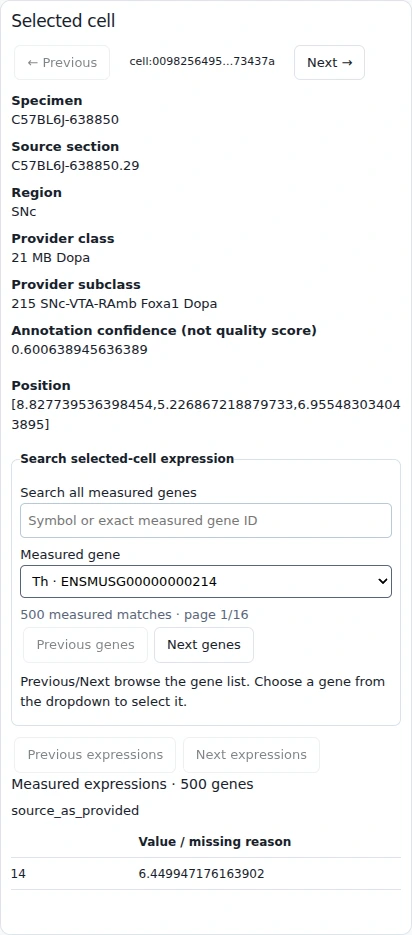
Figure 2Open the selected-cell inspector. The inspector shows the selected cell's taxonomy, source section, and measured Th value; it is not a spatial view.
Focused selected-cell review supports candidate section discussion. Click to enlarge.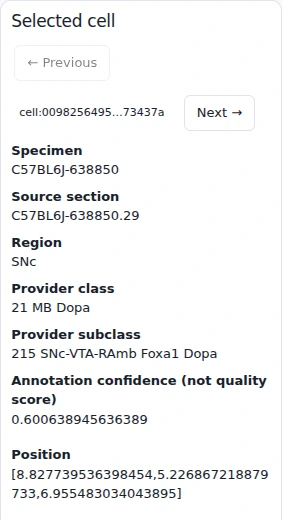
Figure 3Review the source-section view. Section C57BL6J-638850.29 is available for follow-up.
A source-section-constrained record is reviewable before commitment. Click to enlarge.
Scope
These captures describe the public release and support cohort definition and record review; quantitative validation remains a downstream analysis step.
Useful deliverable
A short list of source-traceable midbrain candidates.
Current capability and extensions
Explorer supports candidate selection and record inspection.
Meaningful pilot success criteria
The team can choose cells and sections to evaluate with its own experimental criteria.