Illustrative research workflow
Explore now
Map D1 and D2 cells in the striatum
How do separately defined Drd1 and Drd2 cohorts map in CP?
Scientific context
The CP filters separate 061 STR D1 Gaba with Drd1 from 062 STR D2 Gaba with Drd2 in the public release.
The capture records each selection, its live count, taxonomy, source section, and the selected record's measured value.
A careful workflow
- Set Display limit to 100,000 through the Explorer UI.
- Apply the recorded source filters and review displayed versus matching counts.
- Inspect provenance before export or downstream interpretation.
Live Explorer walkthrough
What the current app shows
These are browser captures of the public Allen MERFISH release in NeuroViz. Open this captured cohort in Explorer.
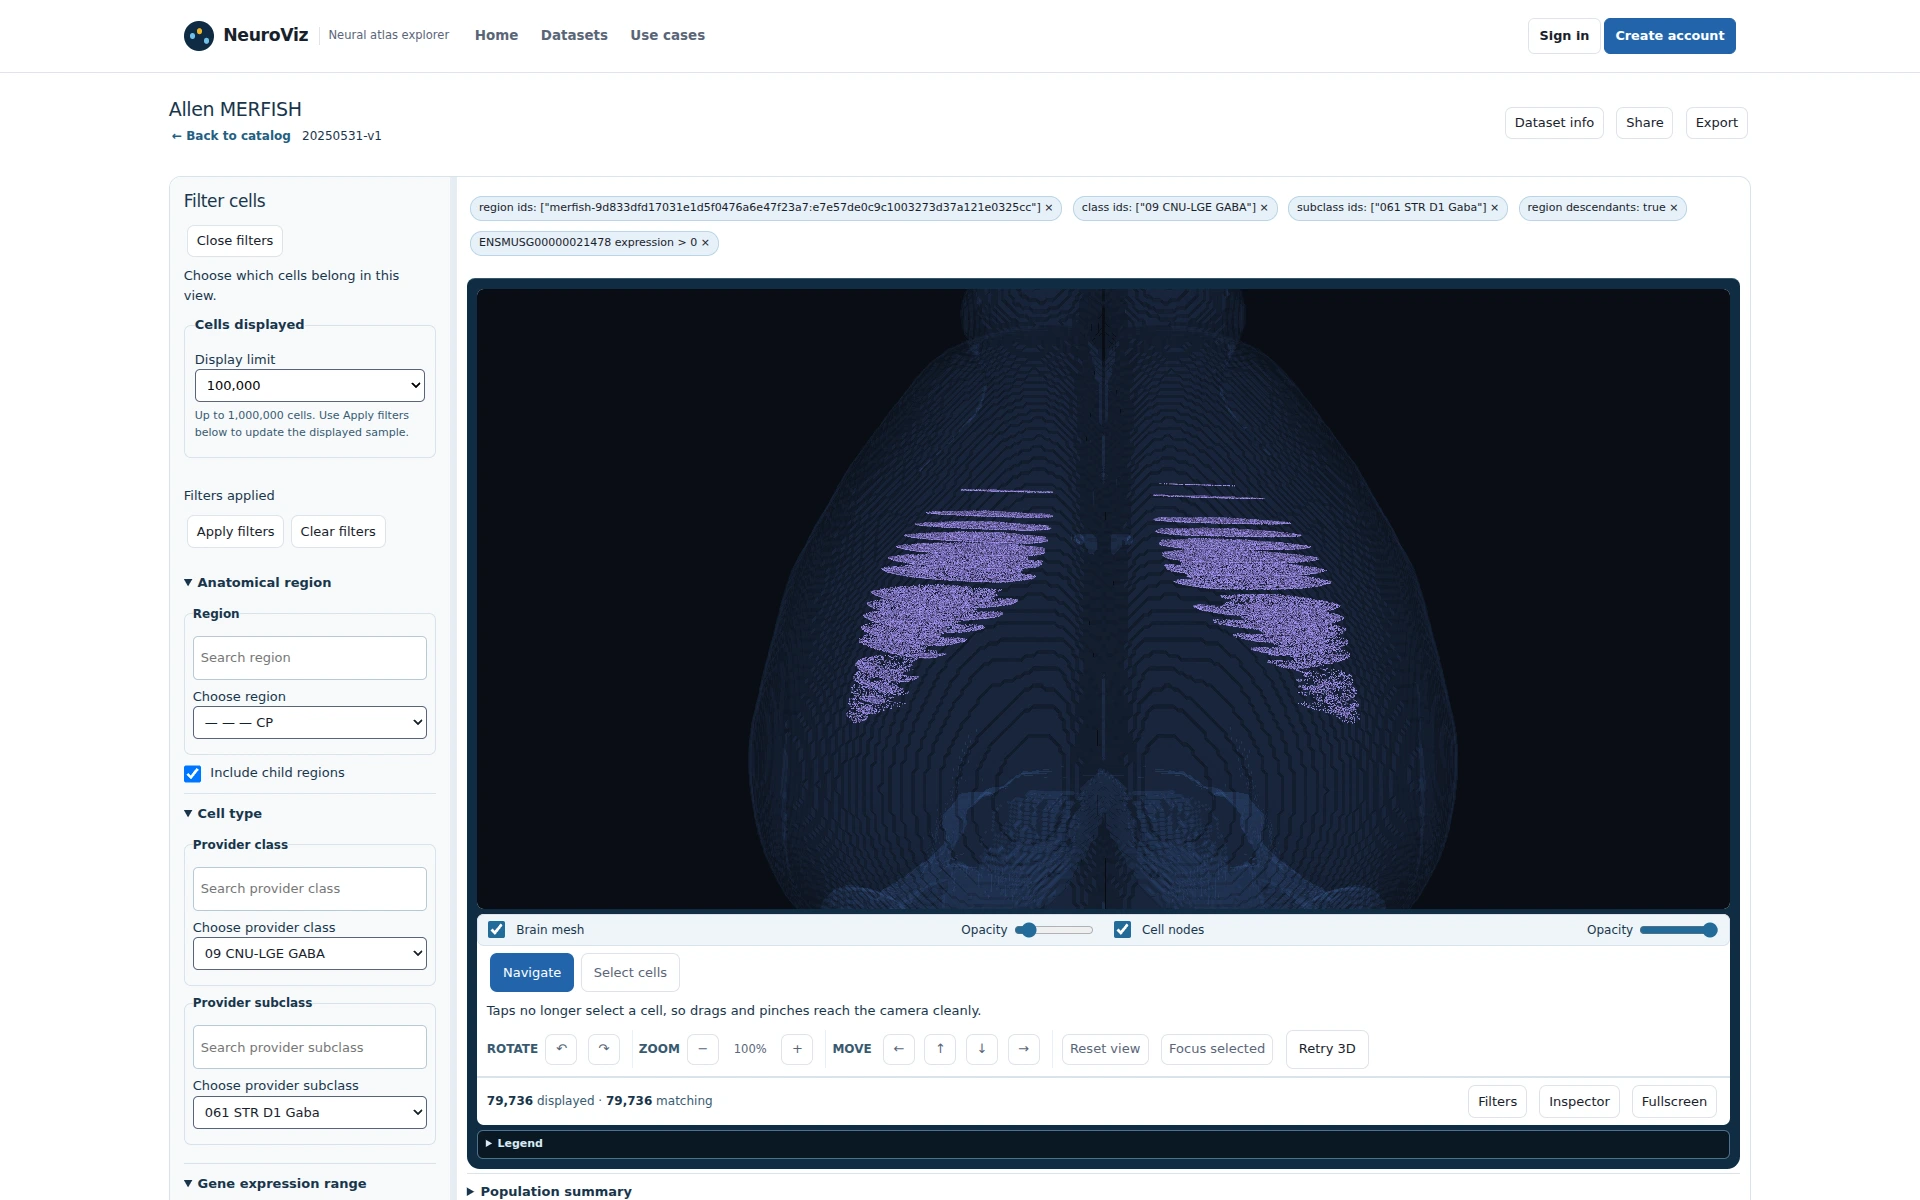
Figure 1Apply CP, STR D1 Gaba, and measured Drd1 at 100,000. The map and live count define the D1 cohort.
CP STR D1 Gaba with measured Drd1 applied. Click to enlarge.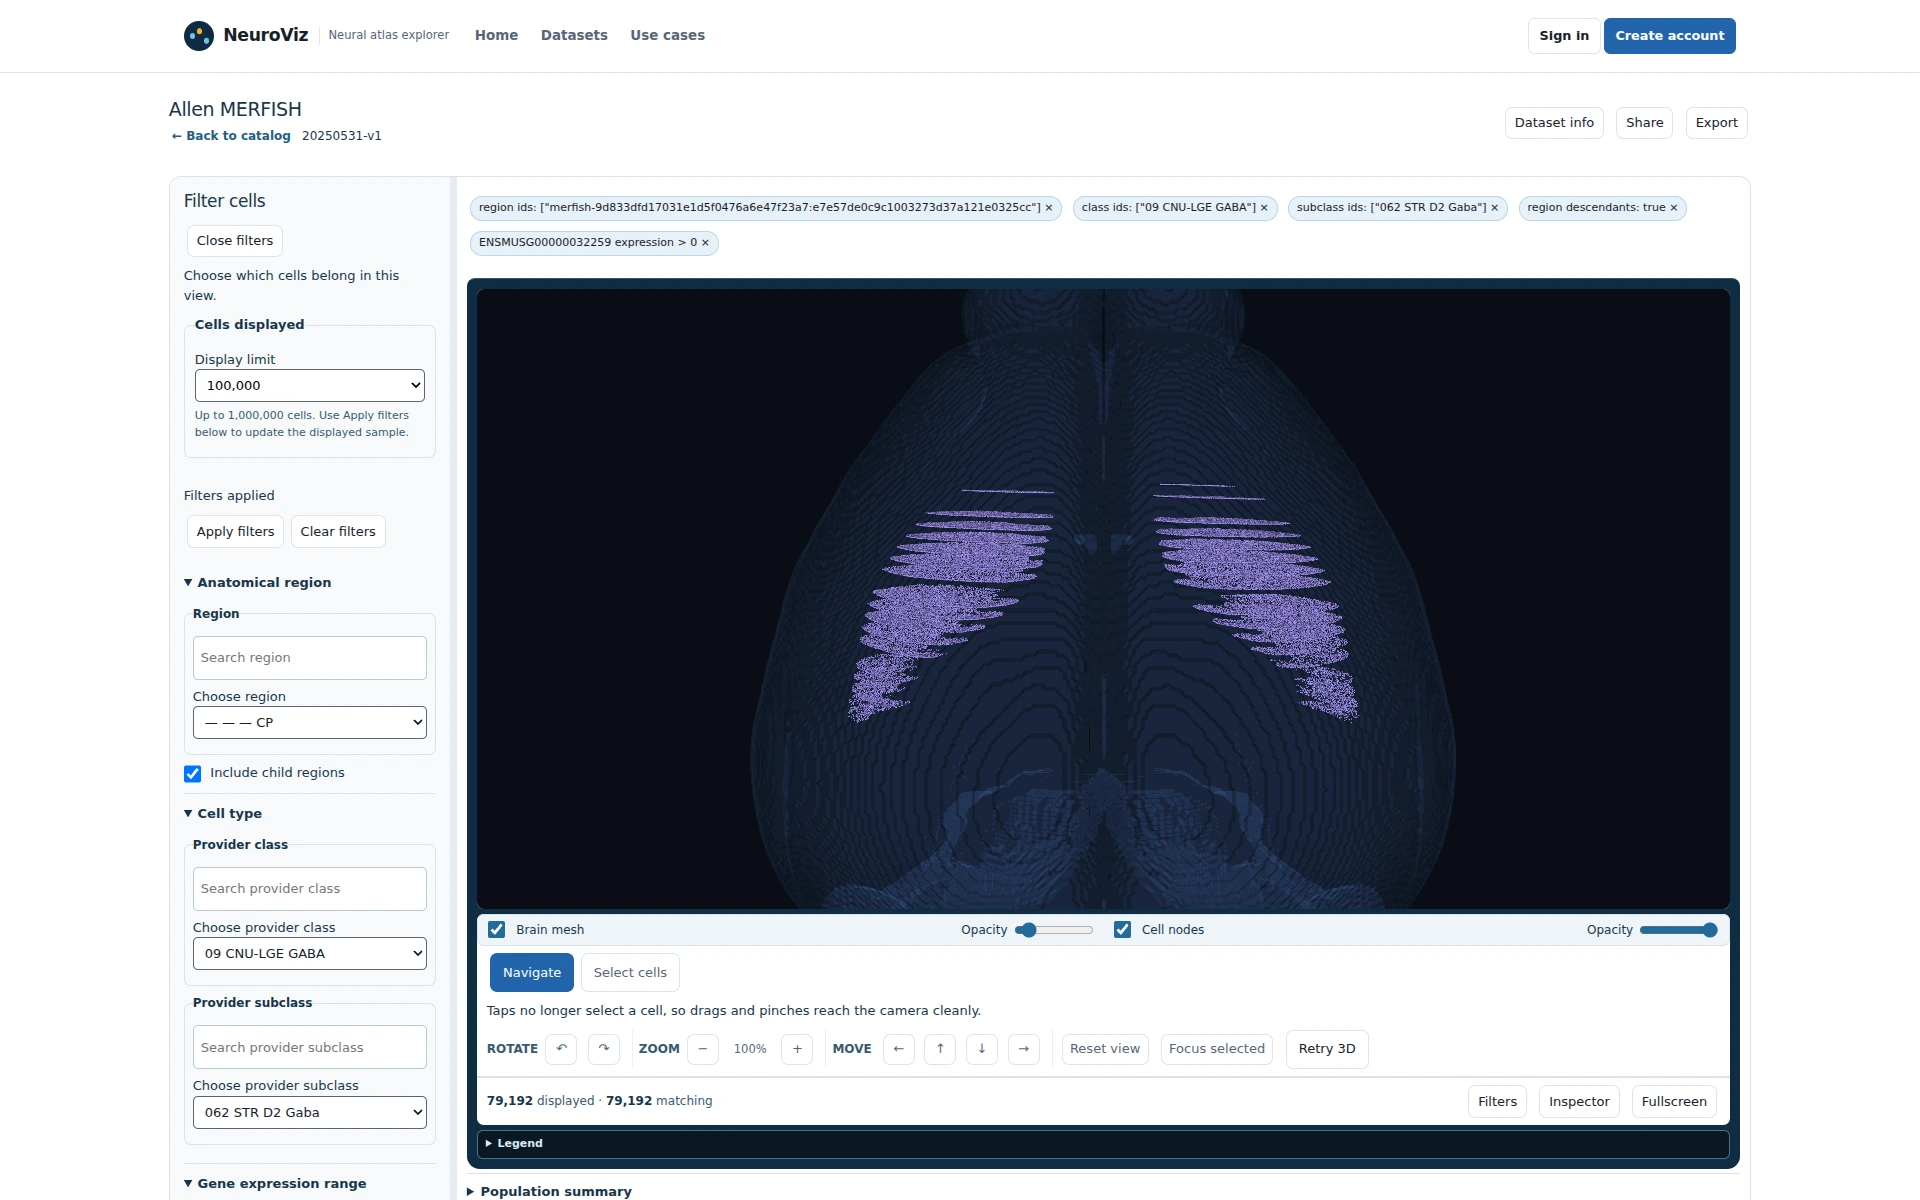
Figure 2Switch to STR D2 Gaba and measured Drd2. The second map remains a distinct cohort.
The separate CP STR D2 Gaba / measured Drd2 extraction definition. Click to enlarge.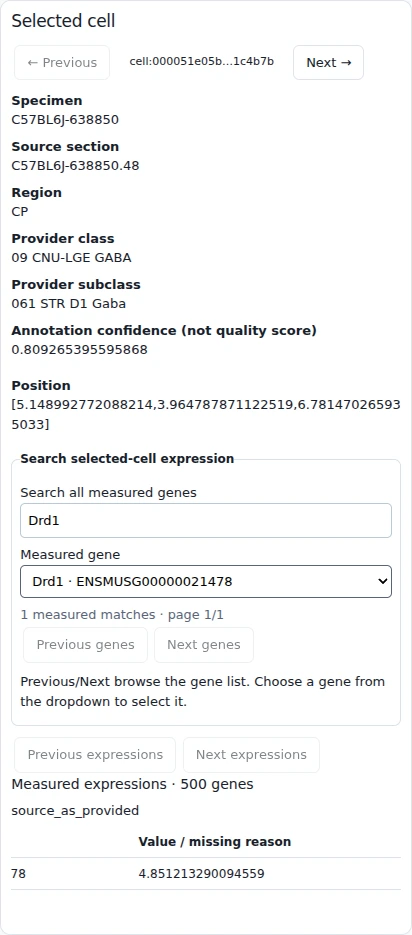
Figure 3Inspect a D1 record before export. Source section, taxonomy, and the measured value are visible.
A selected D1 record keeps section, taxonomy, coordinates, and measured evidence. Click to enlarge.
Scope
These captures describe the public release and support cohort definition and record review; quantitative validation remains a downstream analysis step.
Useful deliverable
Two source-bounded striatal cohort definitions.
Current capability and extensions
Filtering, inspection, and export are available in the Explorer.
Meaningful pilot success criteria
A colleague can replay both cohorts and carry them into a downstream comparison.